

| No | Item.Requested.for.client | Notes | For.the.quotation | For.the.SDS.preparation |
|---|---|---|---|---|
| 1 | Product name, code, and trade name | Include any alternate/trade names | Yes | Yes |
| 2 | Company name, address, Tax ID | Legal entity and registration details | Yes | Yes |
| 3 | Manufacturer / supplier details | If different from customer | Yes | Yes |
| 4 | Required delivery date | Deadline for the completed SDS | Yes | Yes |
| 5 | Required language(s) | For the final SDS | Yes | Yes |
| 6 | Format requirement | e.g., 16-section GHS format, or specific regional template | Yes | Yes |
| 7 | Version of GHS | 3, 6, 7, 9, | Yes | Yes |
| 8 | Certificate of Analysis (COA) | Latest batch | No | Yes |
| 9 | Existing SDS (if any) | Original language and/or English version | No | Yes |
| 10 | Full ingredients list | With CAS No. and concentration (%) of each component | No | Yes |
| 11 | Intended use / application | How the product will be used | No | Yes |
| 12 | Emergency contact number | 24-hour contact, if available | No | Yes |
| 13 | Country(ies) of sale / distribution | Determines applicable regulation: OSHA, CLP, GHS, WHMIS, etc. | No | Yes |
| 14 | Physical/chemical property data | pH, flash point, boiling point, density, solubility, etc. (if available) | No | Yes |
| 15 | Toxicological / safety test data | If available | No | Yes |
| 16 | Transport classification info | UN No., packing group, hazard class — or confirm "not regulated" | No | Yes |
| 17 | Product specification / technical data sheet (TDS) | NA | No | Yes |
| 18 | Sample product label | If already designed | No | Yes |
| 19 | Previous SDS revision / history | If this is an update rather than a new SDS | No | Yes |
INFORMATION
2026-09-12 10:43:00
最近、タイ語SDS、英語SDS作成に関する引き合いが顕著に増えている。
入手した現行SDSを精査すると、全てのSDSの品質は弊社の合格ラインに到達していなかった。
例えば、セクション2:危険有害性の要約,セクション3:組成及び成分情報で付与された有害性区分を裏付ける根拠が、セクション11:有害性情報等で全く言及されていなかった。それにもかかわらず、外部機関がそのSDSに署名をしているなど、まるでコントだ。
特に、発がん性区分Xを付与したにもかかわらず、その根拠をSDS中で示していない事例などは、論外だ。
SDS作成費用の多寡だけで、コンサル企業を選ばないでほしい。
2026-09-10 20:07:00
2026-09-03 15:48:00
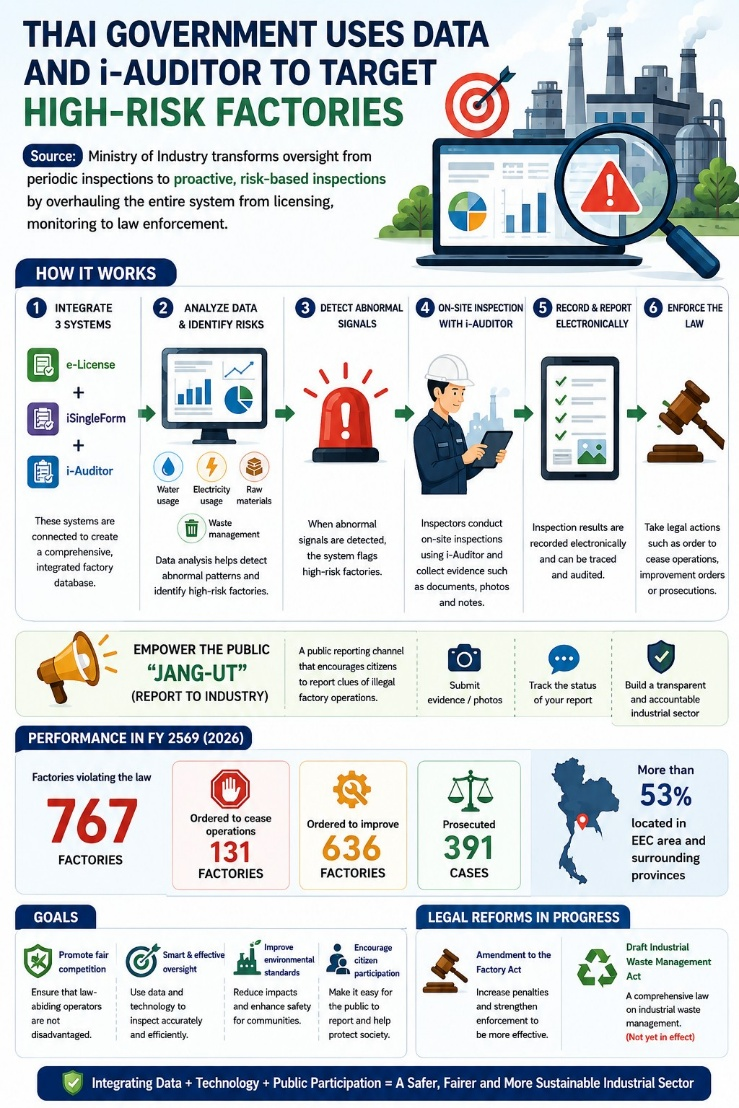
The Ministry of Industry is transforming factory oversight into Data-Driven Regulation, using data and digital technology to assess risks and identify irregularities, enabling more targeted and effective inspections.
One of the key tools is i-Auditor, a digital system that enables officials to record inspection results, attach evidence, prepare reports, and systematically track corrective actions. The system helps reduce paperwork and promotes greater consistency in factory inspections.
Factories Violating Pollution Standards May Face Immediate Shutdowns
A key change is the strengthened enforcement of regulations against factories that release pollutants above prescribed standards or fail to properly manage industrial waste.
In the past, when a factory caused pollution by discharging wastewater or air pollutants beyond legal limits, officials from the Department of Industrial Works (DIW) could order the factory to take corrective action within a specified period under the first paragraph of Section 37 of the Factory Act.
Under the new proactive regulatory approach, the use of data and the i-Auditor system will enable officials to assess risks and monitor issues more quickly. Factories that violate pollution control requirements may be ordered to suspend or shut down operations immediately, subject to the powers and conditions prescribed by law.
2026 Performance
In 2026, 767 factories were found to have violated the law, resulting in 131 suspension orders, 636 corrective action orders, and 391 legal proceedings.
The enhancement of i-Auditor under the ONE MIND policy is an important step toward developing a factory oversight system that is faster, more transparent, and traceable. It also supports equal compliance with legal requirements and contributes to raising Thailand’s industrial standards sustainably.
Source: The Nation, August 16, 2026, and the Ministry of Industry
Data from : https://www.thaigov.go.th/th/news/168308
: https://www.nationthailand.com/business/economy/40069853
2026-09-03 15:43:00
กระทรวงอุตสาหกรรมปรับการกำกับดูแลโรงงานสู่ Data-Driven Regulation โดยนำข้อมูลและเทคโนโลยีดิจิทัลมาใช้ประเมินความเสี่ยงและระบุความผิดปกติ เพื่อให้การตรวจสอบเป็นไปอย่างตรงจุดและมีประสิทธิภาพมากขึ้น
หนึ่งในเครื่องมือสำคัญคือ i-Auditor ระบบดิจิทัลที่ช่วยให้เจ้าหน้าที่บันทึกผลการตรวจ แนบหลักฐาน จัดทำรายงาน และติดตามการแก้ไขข้อบกพร่องได้อย่างเป็นระบบ ลดการใช้เอกสาร และช่วยให้การตรวจสอบมีมาตรฐานเดียวกันมากขึ้น
โรงงานฝ่าฝืนมาตรฐานมลพิษ อาจถูกสั่งปิดทันที
การเปลี่ยนแปลงที่สำคัญคือการยกระดับการบังคับใช้กฎหมายกับโรงงานที่ ปล่อยมลพิษเกินกว่ามาตรฐานที่กำหนด หรือไม่สามารถจัดการกากอุตสาหกรรมได้อย่างถูกต้อง
ในอดีต หากโรงงานก่อให้เกิดมลพิษจากการปล่อยน้ำเสียหรือมลพิษทางอากาศเกินกว่าค่าที่กฎหมายกำหนด เจ้าหน้าที่กรมโรงงานอุตสาหกรรม (DIW) สามารถมีคำสั่งให้โรงงานดำเนินการแก้ไขภายในระยะเวลาที่กำหนด ตามวรรคหนึ่งของมาตรา 37 แห่งพระราชบัญญัติโรงงาน
ภายใต้แนวทางการกำกับดูแลรูปแบบใหม่ การใช้ข้อมูลและระบบ i-Auditor จะช่วยให้เจ้าหน้าที่สามารถประเมินความเสี่ยงและติดตามปัญหาได้รวดเร็วยิ่งขึ้น โดยโรงงานที่ฝ่าฝืนข้อกำหนดด้านมลพิษอาจ ถูกสั่งหยุดหรือปิดกิจการได้ทันที ตามอำนาจและเงื่อนไขที่กฎหมายกำหนด
ผลการดำเนินงาน ปี 2569
ในปี 2569 พบโรงงานผิดกฎหมาย 767 ราย โดยมีการดำเนินการ ได้แก่ สั่งหยุดกิจการ 131 ราย สั่งปรับปรุงแก้ไข 636 ราย และดำเนินคดี 391 ราย
การยกระดับ i-Auditor ภายใต้นโยบาย ONE MIND จึงเป็นส่วนสำคัญในการพัฒนาระบบกำกับดูแลโรงงานให้มีความ รวดเร็ว โปร่งใส และตรวจสอบย้อนหลังได้ พร้อมส่งเสริมให้ผู้ประกอบการปฏิบัติตามกฎหมายอย่างเท่าเทียม และยกระดับมาตรฐานอุตสาหกรรมไทยอย่างยั่งยืน
ที่มา: The Nation, 16 August 2026 และกระทรวงอุตสาหกรรม
ข้อมูลจาก : https://www.thaigov.go.th/th/news/168308
: https://www.nationthailand.com/business/economy/40069853
2026-08-27 19:15:00
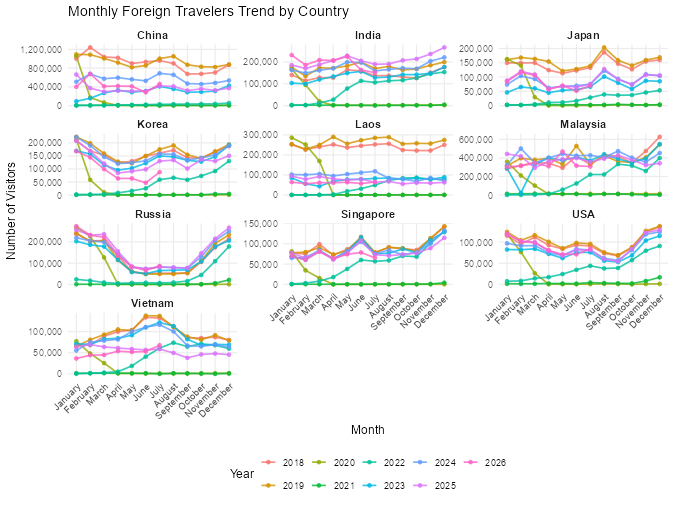
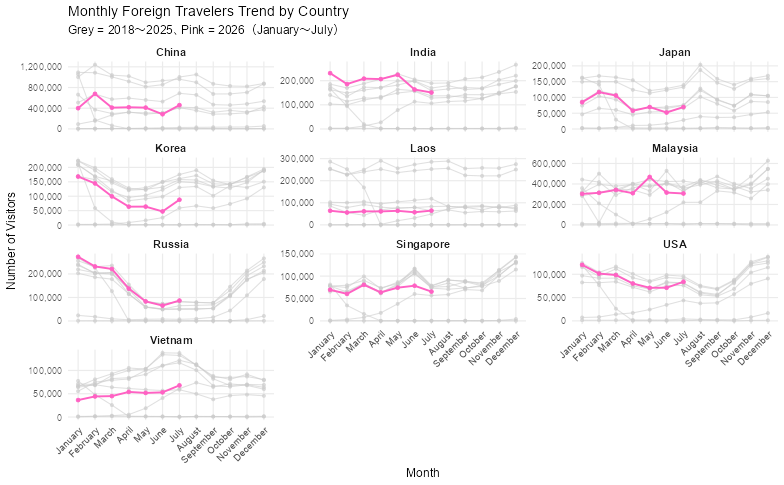
Prepared by HS-TECH with ggplot2 in positron.
Here is a summary of the characteristics of travelers from the top 10 countries, with detailed insights for Japan, China, the US, and Russia, and concise overviews for the rest based on the data trends from 2018 to 2026.
Japan
Travelers from Japan have shown a steady pattern with notable seasonality, typically peaking slightly in August and December. Pre-2020, annual visitor numbers were around 1.7 to 1.8 million. While the numbers fell sharply during 2020–2021, a gradual recovery began in late 2022. By 2025, annual travelers surpassed 1 million again, though this is still roughly 60% of pre-pandemic levels. The recovery has been relatively cautious compared to other nations, with stable numbers returning but not yet reaching previous highs.
China
China is a massive volume driver, consistently contributing the highest number of travelers. Before 2020, annual arrivals exceeded 11 million. The data reflects a rapid post-2022 rebound, with over 3.5 million arrivals in 2023 and a massive surge to 6.7 million in 2024. Interestingly, this momentum slowed to around 4.4 million in 2025. Chinese travel patterns show strong peaks during early-year holidays (like January) and mid-summer (July/August), demonstrating high sensitivity to major holiday periods.
United States
The US represents a highly stable, long-haul travel market. Before 2020, annual arrivals were consistently around 1.1 to 1.2 million. The recovery here has been robust and rapid; by 2024, the numbers had already bounced back to over 1 million, and by 2025, they were near the 1.1 million mark again. The US shows distinct travel peaks during the winter holidays (December/January), indicating a preference for escaping colder weather or utilizing holiday time for long-distance travel.
Russia
Russia exhibits the most extreme seasonal travel patterns among the top 10 countries. Arrivals skyrocket during the winter months (December through February), with single-month arrivals frequently exceeding 200,000, while summer numbers (June/July) drop drastically to under 80,000. Remarkably, the Russian market recovered rapidly; total arrivals in 2024 (1.74 million) and 2025 (1.89 million) have actually exceeded pre-2020 levels, indicating a very strong and growing preference for winter travel to this destination.
Brief Summaries for Other Nations:
-
Malaysia: The highest volume driver from neighboring countries, quickly rebounding to pre-pandemic levels (close to 4.9 million in 2024) with relatively stable month-to-month traffic.
-
India: Showing aggressive growth, exceeding pre-2020 numbers by 2024 and reaching nearly 2.4 million in 2025, driven by steady year-round arrivals.
-
South Korea: A major contributor (around 2 million pre-2020) that showed a strong initial rebound in 2023–2024, though numbers slightly softened in 2025.
-
Laos: Represents consistent cross-border traffic, with a solid recovery peaking at 1.1 million in 2024, maintaining steady volumes without extreme seasonal spikes.
-
Singapore: A very stable market that has largely recovered to its pre-2020 baseline of around 1 million annual travelers, maintaining consistent flow throughout the year.
-
Vietnam: Demonstrated a strong early recovery in 2023 (over 1 million) but has seen numbers drop significantly in 2025, showing higher volatility compared to other regional neighbors.