

INFORMATION
Thailand Province-Level Analysis
This report summarizes two province-level scatter analyses relating Gross Provincial Product (GPP) per capita to two health outcomes: life expectancy at birth (2020) and suicide rate (2019). Both analyses cover all 77 Thai provinces.
1 GPP per Capita vs. Life Expectancy (2020)
Overall correlation: Pearson r ≈ -0.36 (n = 77 provinces) — a weak-to-moderate negative relationship. Higher GPP per capita is associated with slightly lower life expectancy across provinces.

1.1 By 8 Regions
| Region group | Mean GPP/capita (Baht) | Life expectancy (yrs) |
|---|---|---|
| Bangkok | 585,689 | 74.7 |
| East | 353,730 | 75 |
| Central | 214,621 | 75.1 |
| North | 105,101 | 75.7 |
| Perimeter | 277,842 | 76.1 |
| Northeast | 80,127 | 76.5 |
| West | 155,443 | 77 |
| South | 136,596 | 77.8 |
1.2 Key observations
-
The richest provinces — Rayong, Bangkok, Prachin Buri (all industrial / Eastern-seaboard) — sit at the lowest life-expectancy tier.
-
The South and Northeast — lower-GPP regions — have the highest average life expectancy.
1.3 Note
- Important data limitation: life expectancy is only published at the regional level (8 groups) by NESDB/NSO for 2020, not by individual province. Every province in the same region-group shares an identical assigned value, so this correlation reflects a regional pattern rather than true province-specific variation.
2 GPP per Capita vs. Suicide Rate (2019)
Overall correlation: Pearson r ≈ -0.20 (log GPP, n = 77 provinces) — a weak negative relationship. Higher GPP per capita is associated with slightly lower suicide rate.
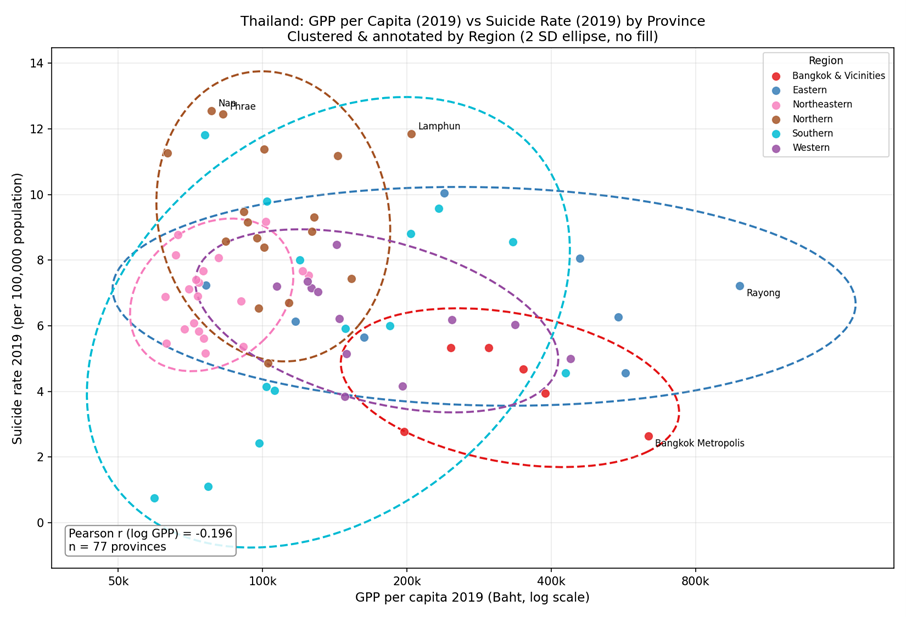
2.1 By 6 regions
| Region | Mean GPP/capita (Baht) | Suicide rate (per 100,000) |
|---|---|---|
| Bangkok & Vicinities | 352,508 | 4.11 (lowest) |
| Southern | 162,237 | 6.1 |
| Western | 191,117 | 6.15 |
| Eastern | 395,695 | 6.9 |
| Northeastern | 79,897 | 6.94 |
| Northern | 109,503 | 9.33 (highest) |
2.2 Key observations
-
Bangkok & Vicinities (highest GPP) has the lowest suicide rate, consistent with the overall negative trend.
-
The Northern region is a clear outlier: it has only middling GPP but the highest suicide rates — Nan, Phrae, and Lamphun all exceed 11 per 100,000.
-
The Northeast, despite being the poorest region by GPP, is mid-pack for suicide rate, not the worst — breaking a simple “poorer means higher risk” story.
-
Southern provinces — Narathiwat, Pattani, Yala — have the lowest suicide rates in the country (under 2.5), despite modest GPP, likely reflecting cultural/religious factors in this majority-Muslim region rather than economic conditions.
-
Suicide rate 2019 was computed from raw counts: (male deaths + female deaths) / (male population + female population) × 100,000, combining both sexes rather than averaging published sex-specific rates.
3 Combining the Two Analyses
-
Both relationships point in the same direction — provinces with higher GPP per capita trend toward a slightly lower suicide rate, but slightly lower (not higher) life expectancy. However, neither relationship is strong: r² is approximately 13% for life expectancy and 4% for suicide rate, meaning GPP per capita explains only a small share of the variation in either outcome.
-
The life-expectancy result is likely confounded by industrial and environmental exposure in high-GPP Eastern-seaboard provinces. The suicide-rate pattern is dominated by a distinct Northern-region effect that overwhelms any simple wealth-based explanation. GPP per capita should be treated as a weak, non-causal predictor for either outcome on its own — other factors (healthcare access, environmental exposure, culture, religion, urbanization, and reporting practices) likely play a larger role.
Note: Note: This is a descriptive, exploratory summary intended to surface patterns for further investigation — not a causal or policy analysis.